In this article, we are going to discuss the dashboard we use for tracking our e2e-testing pipelines and how it is integrated with github-action pipelines.
Even before starting with the functionalities, you can check out the dashboard here.
Why?
Firstly, why do we need an E2E dashboard? Isn’t the github actions showing everything we needed or were there some more requirements that we had apart from what github actions offer?

So, when we started, we had just 2–3 pipelines with which it was easy to go through different pipeline runs and check how our nightly pipelines are working or what is the test coverage of our pipelines. But now when we have around 12–15 pipelines, it became difficult to understand the behavior of pipelines just by looking at some of the latest runs. As the main purpose of all pipelines is to help us understand our builds, find out issues before they happen, or find them as soon as possible even after release so that they can be fixed at the earliest. You can’t afford a bug that was added last month to be in the current month’s pipeline as debugging the same can take a very long time.
Now, the answer to all the above problems was to have some type of dashboard through which we can see the historical data of our pipelines whether it is nightly built or manually builds before release candidates or on-demand run. We wanted to see all the details like logs of the pipeline, name of pipeline run, last commit in the repository & the tag of LitmusChaos with which particular pipeline ran, Verdict of the pipeline, steps in the pipeline, etc. Having all these details in one place in UI as a dashboard would help us to have transparency between the developers as well as for checking the health of our product before any release candidate making us more confident in our product.
How is the progress going?
Okay no more waiting, Let’s have a walk-through of the dashboard and its different functionalities.
Firstly, let’s talk about the Homepage, which gives the Gods-Eye look at all the E2E pipelines. This screen contains all the pipelines (Manual & Nightly) along with their current status, last running timestamp & name of the repository where that pipeline is running.
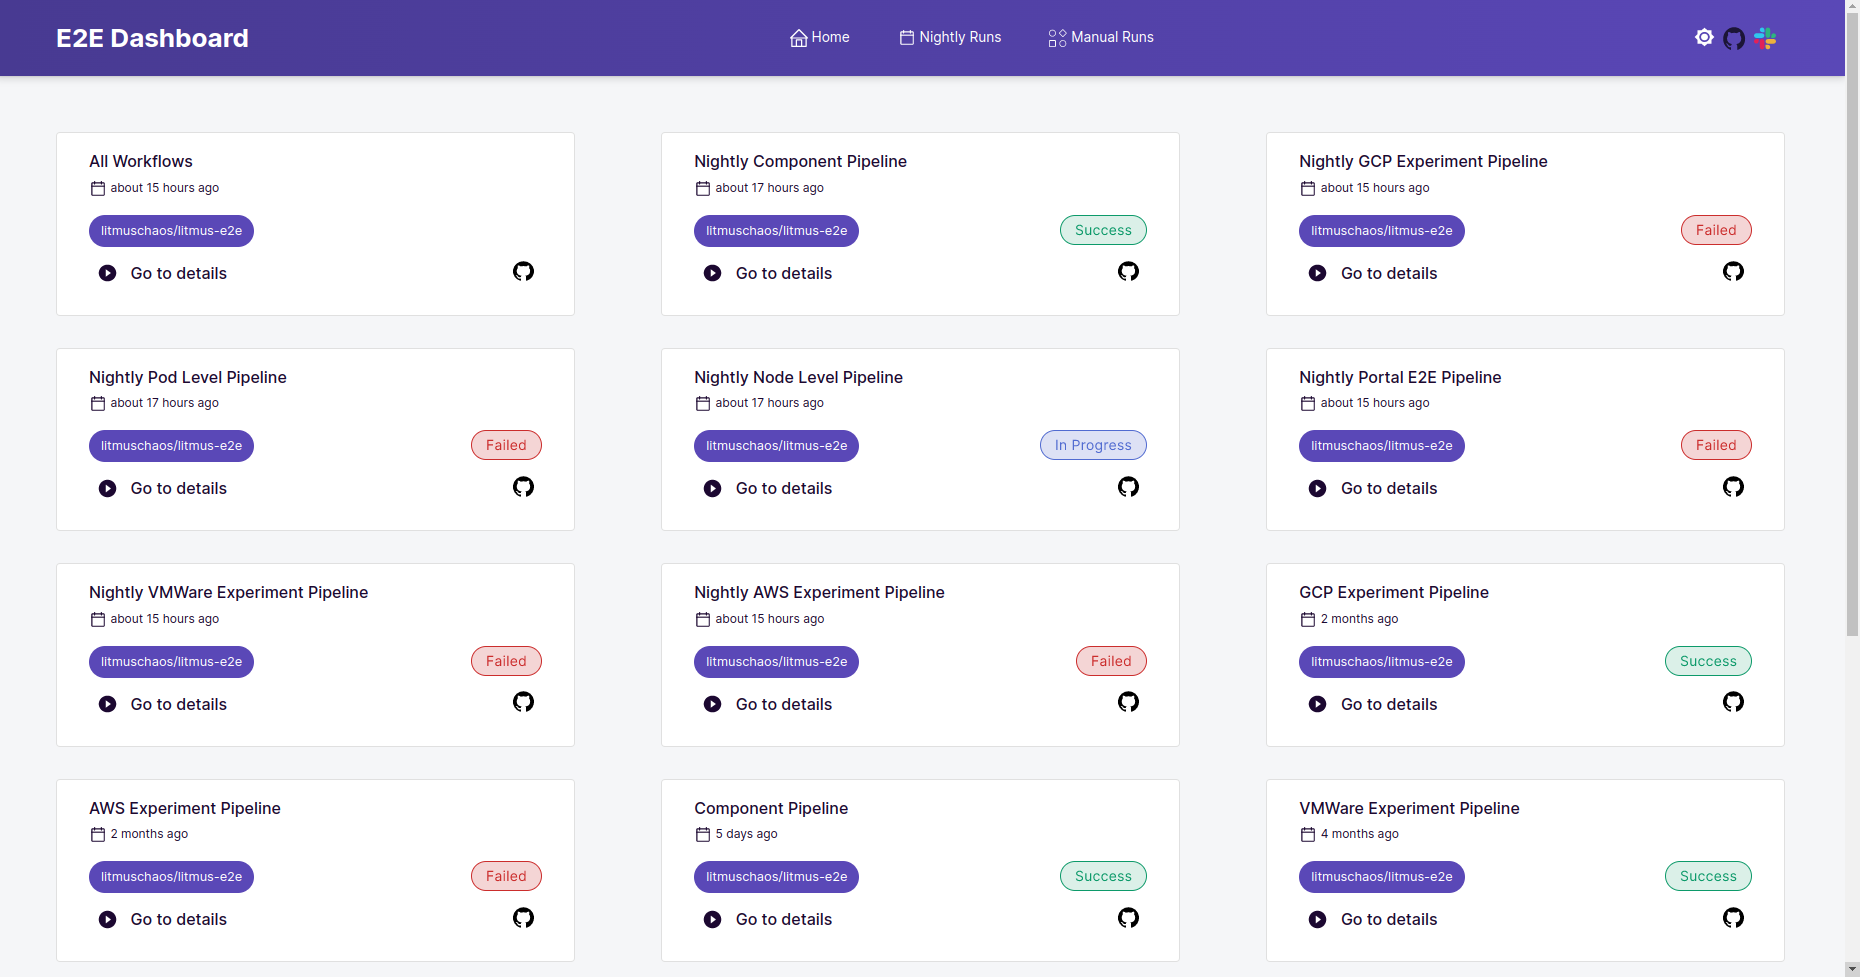
The header contains buttons for navigating to only manual runs and nightly runs. This helps to distinguish between manual & nightly runs.
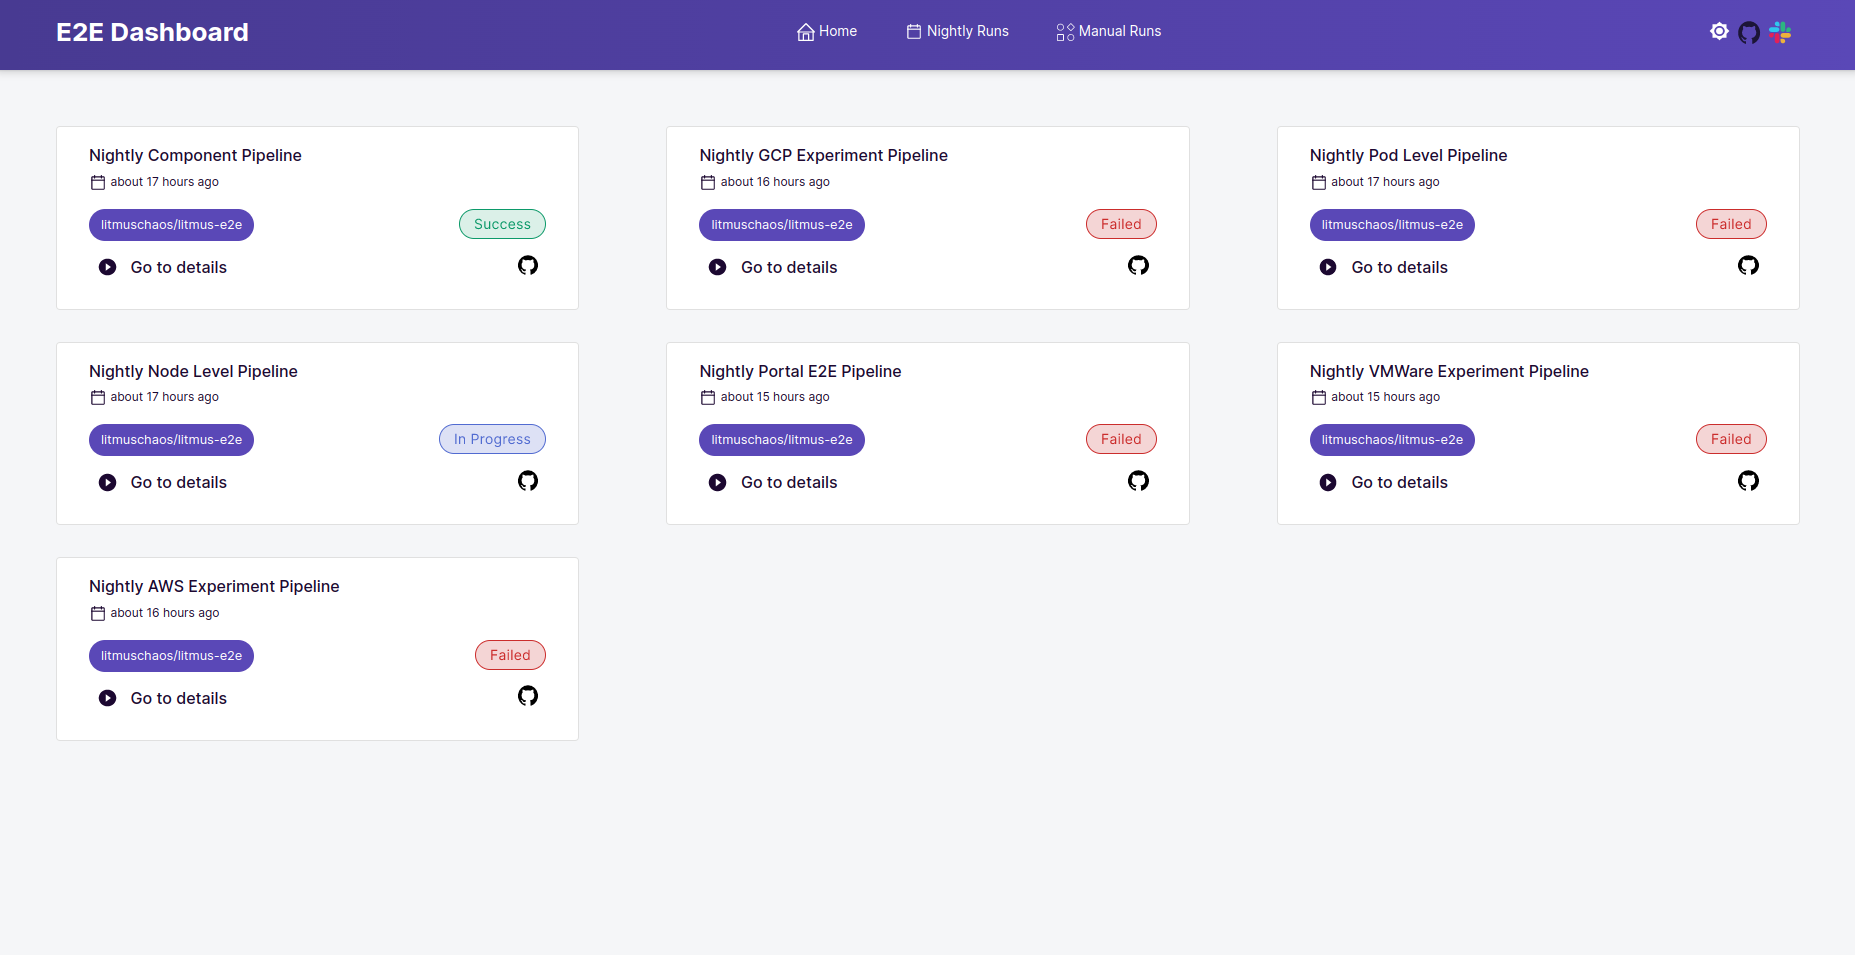
Nightly pipelines are running on daily basis automatically so that we can check status of all builds daily without having to manually trigger the pipelines.
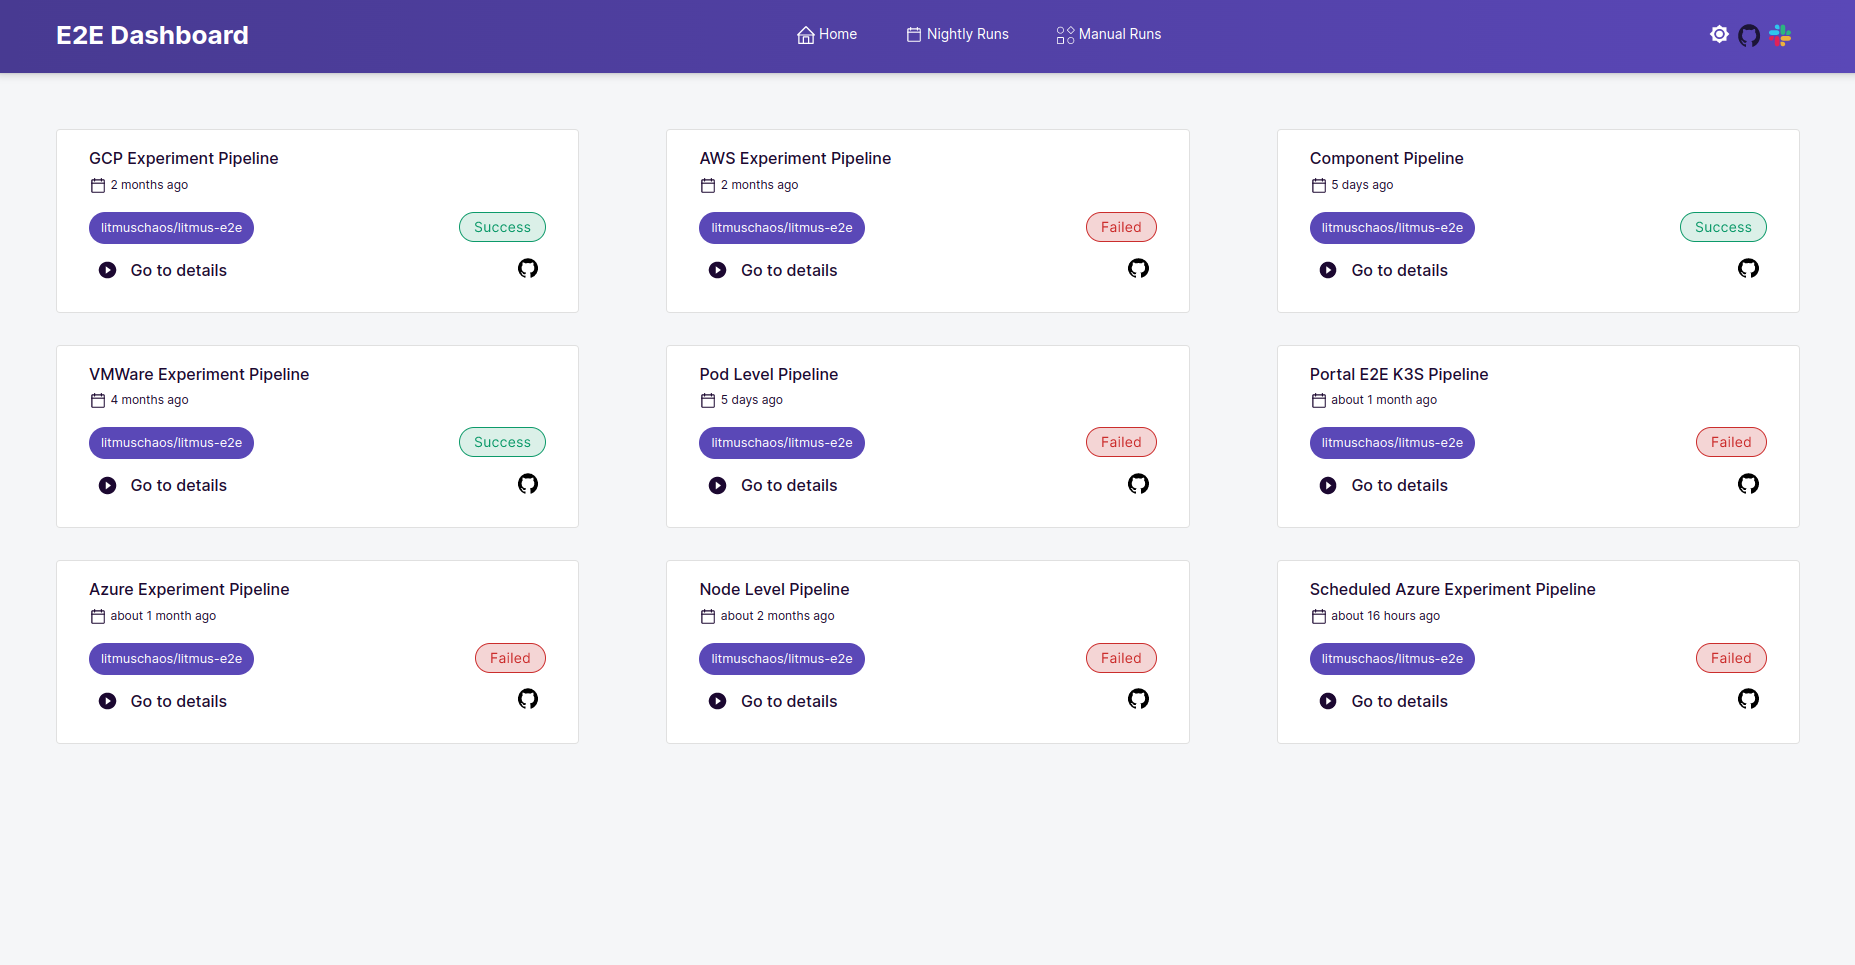
Manual runs are done before/after release for checking the health of release builds and also in cases when we want to run E2E manually for testing any feature.
Deep dive into a Pipeline
When we click on Go to details on a particular pipeline card, It will navigate us to a new screen showing pipeline runs of that particular pipeline.
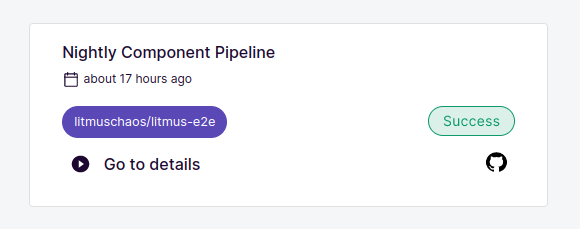
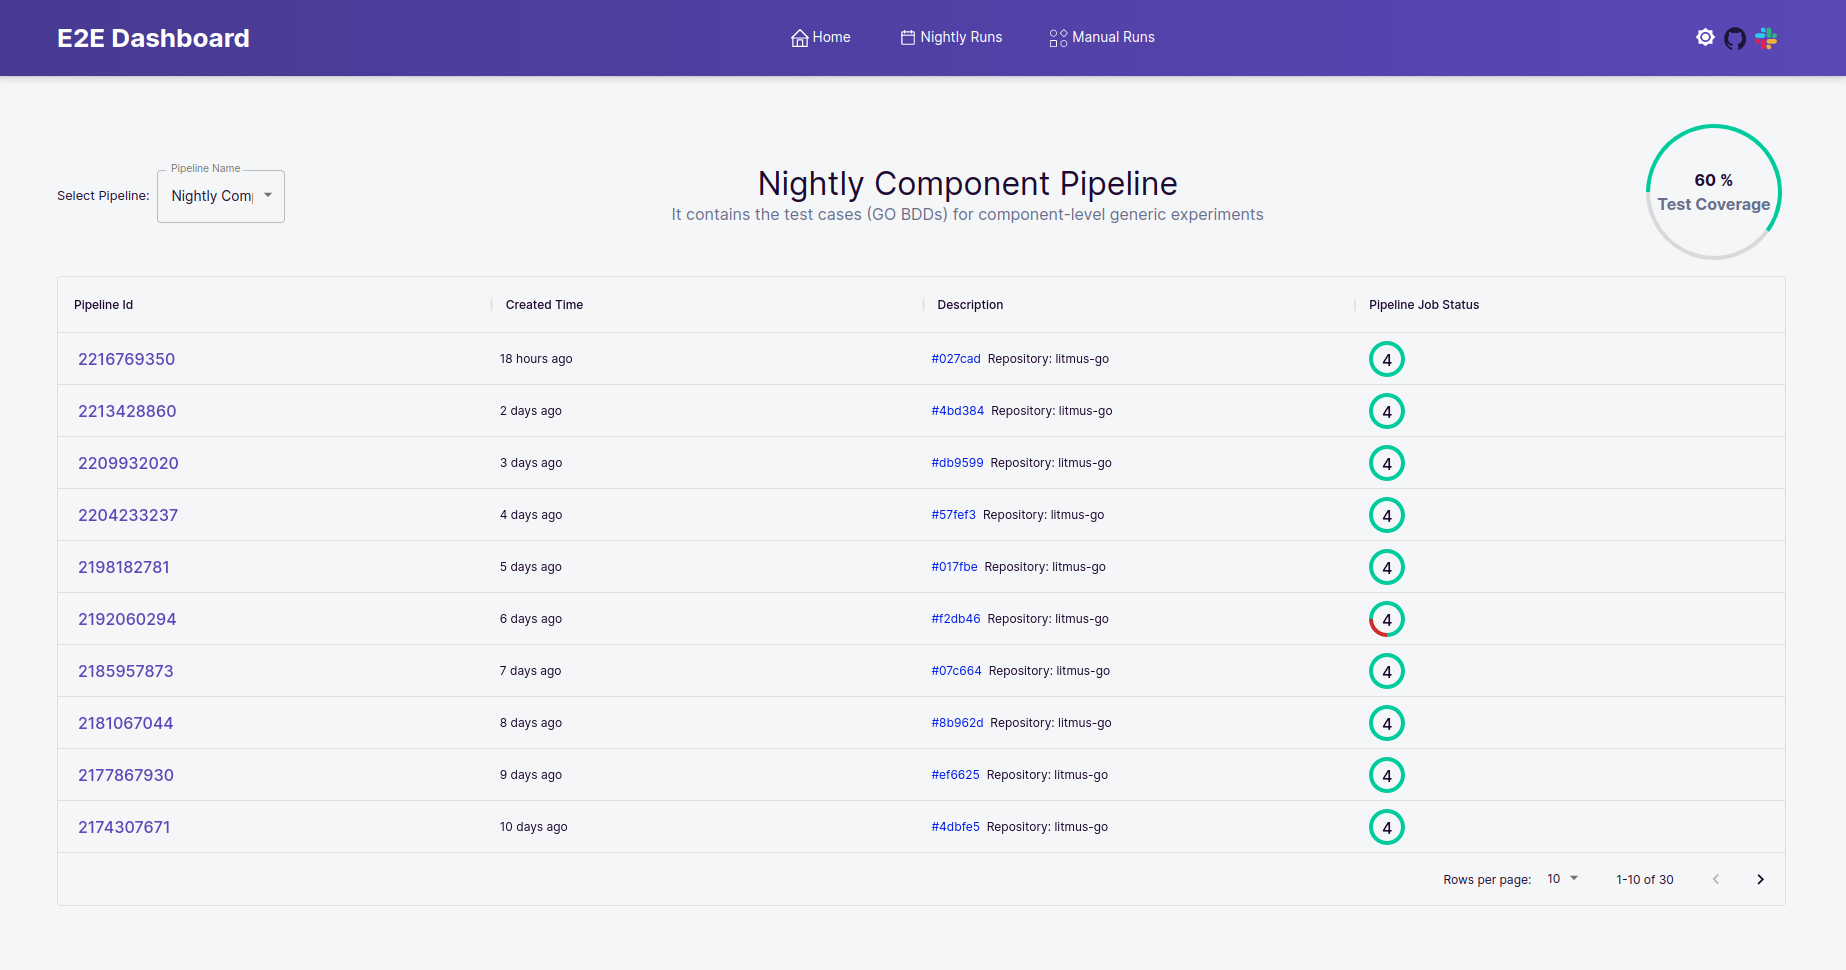
In the above screen, we can see the overall test coverage as well as see historical data of that particular pipeline. The tables show the pipeline-run ID, last running time, description (showing the last commit of the repository after which the pipeline was run), and Pipeline status.
If we click on a pipeline run id in the table, It will open a side modal showing pipeline details like jobs, steps running as part of jobs, the status of jobs, the status of steps, and the total time taken for that particular pipeline run.
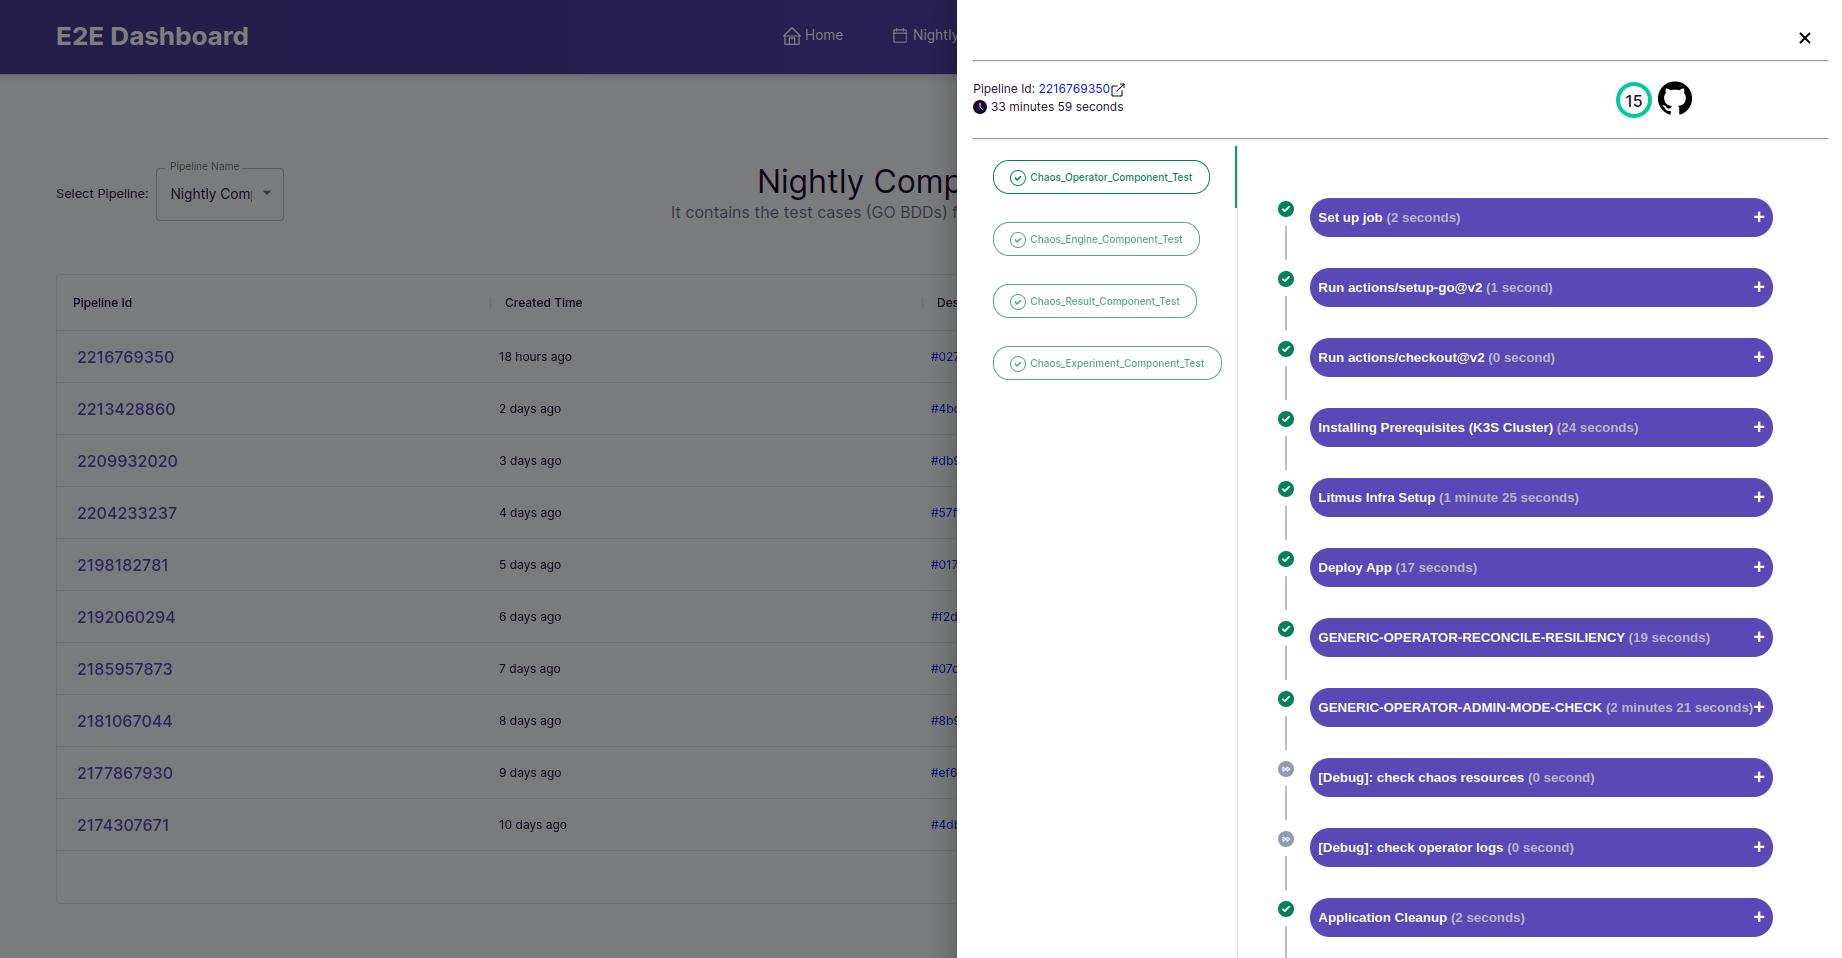
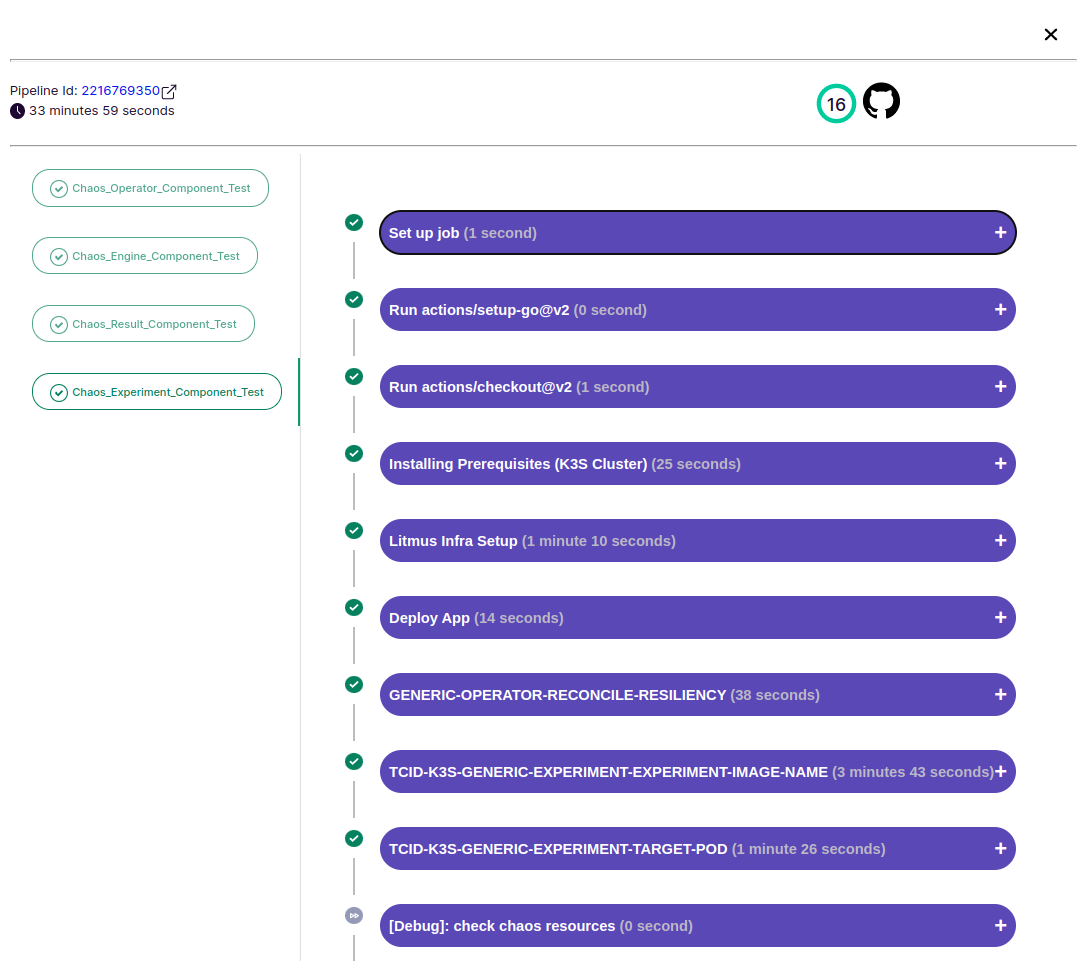
Clicking on a Job will show steps running as part of that Job.
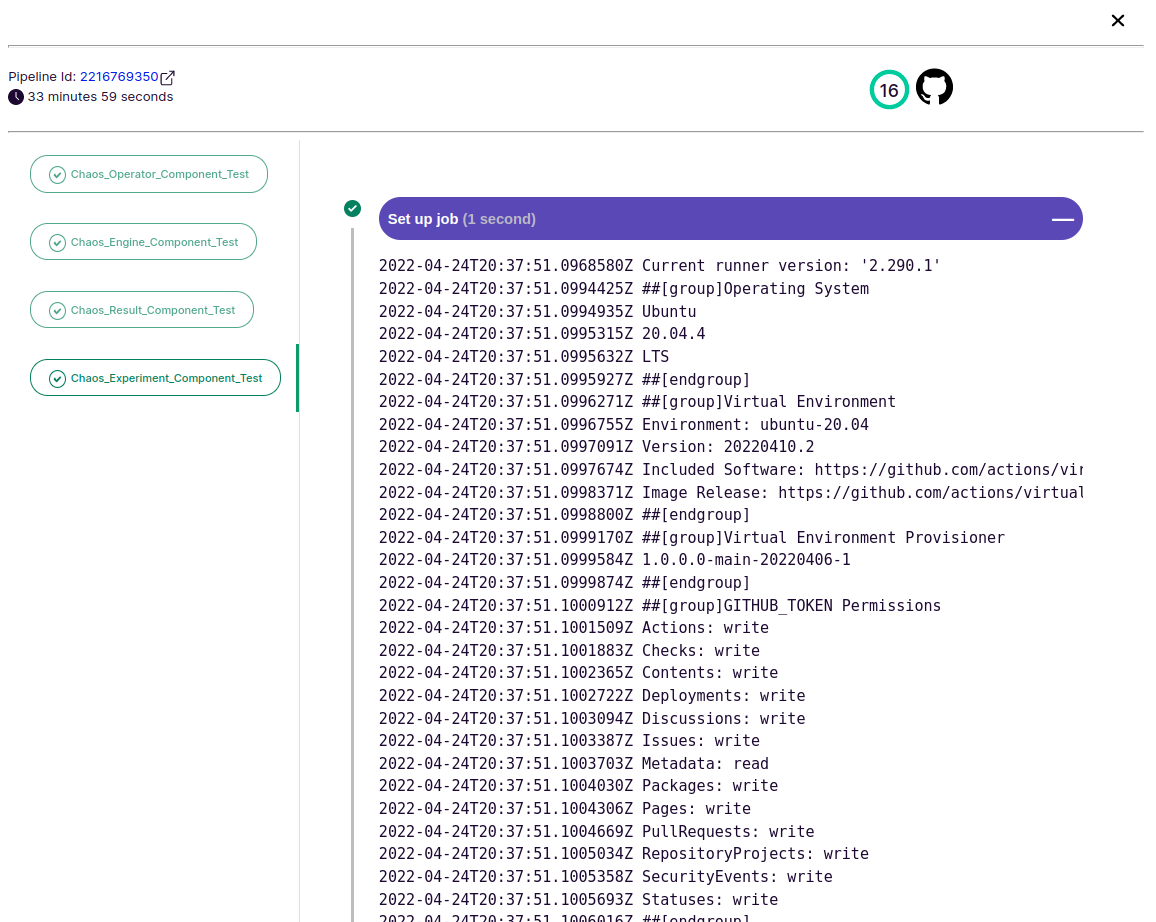
For checking the logs of a step, we can click on a step name and it will expand and shows logs for that step.
So, as we can see that this dashboard provides us everything in one place that we need to check status/health of our product. If we look at the tech-stack of this dashboard, The frontend is implemented using React JS & backend is implemented using Golang. The source code for the same is available here.
There are still some of the functionalities that are needed such as graphical UI for visualising historical data of pipelines, slack notifications/alerts & many more like this.
Conclusion
Feel free to check out our ongoing project — Chaos Center and do let us know if you have any suggestions or feedback regarding the same. You can always submit a PR if you find any required changes.
Make sure to reach out to us if you have any feedback or queries. Hope you found the blog informative!
If chaos engineering is something that excites you or if you want to know more about cloud-native chaos engineering, don’t forget to check out our LitmusChaos website, ChaosHub, and the LitmusChaos repo. Do leave a star if you find it insightful. 😊
I would love to invite you to our community to stay connected with us and get your Chaos Engineering doubts cleared. To join our slack please follow the following steps!
Step 1: Join the Kubernetes slack using the following link: https://slack.k8s.io/
Step 2: Join the #litmus channel on the Kubernetes slack or use this link after joining the Kubernetes slack: https://slack.litmuschaos.io/
Cheers!

